Author Archives: Gordon Rogers

Forecasting weather

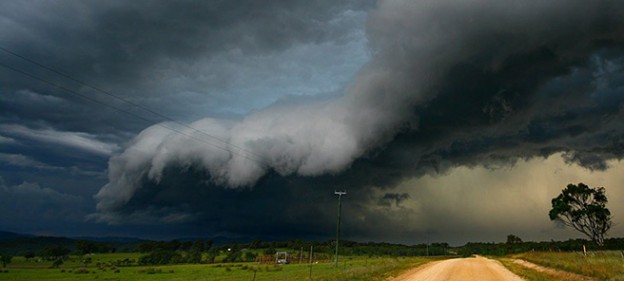
Photo by Anthony Cornelius

The main reputable online sources of weather and climate forecasts for Australia are:

  • Weather and warnings – Bureau of Meteorology
  • Water and the Land (WATL) – Bureau of Meteorology.  WATL brings together climate and weather information. These include rainfall predictions up to 8 days ahead, cumulative seasons rainfall, temperature, wind, pressure, humidity, evaporation, sunshine and El Nino and La Nina patterns.
  • Seasonal outlooks – Bureau of Meteorology.  This site include maps and tables showing anticipated temperatures as well as the chances of high or low rainfall over the next 3 months. There is also regular commentary and forecasts by National Climate Centre climatologists on the Southern Oscillation Index and forecasts of El Nino and La Nina events
  • Multi-week forecasts – Centre for Ocean-Land-Atmosphere Studies.  Temperature and rainfall outlooks for the next 0-5 days, 6-10 days and over 10 day anomalies are available.
  • Multi-week forecasts – Bureau of Meteorology. The Bureau of Meteorology, with help from Managing Climate variability, is developing an Australian multi-week forecast. The bureau will use the POAMA model for weather predictions, which should improve reliability, especially for predicting extreme weather events. These predictions will be 2-4 weeks ahead, making them potentially very useful to vegetable growers.


OzClim

OzClim is the primary site for information on how the climate is predicted to change in the future. This site allows three levels of access to 13 different climate models, 8 different atmospheric greenhouse gas scenarios and rates of global warming to allow users to generate predictions that relate to areas all over Australia.

  1. Step by Step access: This takes users though a simplified set of input criteria and generates a map showing the expected changes in rainfall or temperature over the timeframe requested.
  2. Examples: provides the expected changes to temperature or rainfall from a simplified set of scenarios.
  3. Advanced: Allows full access to the models and criteria with outputs such as maps, GIS data and spreadsheets, and also provides data specific to a large number of regions.

This is an excellent tool, which in summary can:

  • Generate climate change scenarios in a few easy steps.
  • Explore climate scenarios from 2020 to 2100.
  • Guide you through the process of generating your own climate scenarios.
  • Allow you to download maps and projections data for non-commercial research.

OzClim provides a simple step-by-step option to help you generate and explore climate scenarios. There are also six scenarios in the examples section for rainfall and temperature for 2035. The advanced section is designed for the scientific research community and policy-making. You can choose from 23 climate models, eight emission scenarios and three climate sensitivities…

You need to register to use the OzClim site, but the tool is then free!

Cool Farm tool

The Cool Farm Tool (CFT) is a greenhouse gas calculator that is free for growers. It can help them measure the carbon footprint of crops as well as livestock.

The tool is currently being used by the Australian processing tomato industry. It is also being used worldwide by:

  • Unilever (tomatoes)
  • Costco (eggs)
  • Pulse Canada (navy beans)
  • GIZ and Sangana (coffee)
  • Heinz (tomatoes)
  • Oxfam (Broccoli)

The CFT was originally developed by Unilever and researchers at the University of Aberdeen to help growers measure and understand on-farm greenhouse gas emissions. The tool is designed to be simple to use but scientifically robust in the complex arena of carbon accounting. The CFT has been tested and adopted by a range of multinational companies that are using it to work with their suppliers to measure, manage, and reduce greenhouse gas emissions in the effort to mitigate global climate change.

The CFT is a farm-level greenhouse gas emissions calculator based on empirical research from a broad range of published data sets. It is designed to be approachable and easy to complete, using information that a farmer will have readily available. The tool identifies hotspots, makes it easy for farmers to test alternative management scenarios and identifies those that will have a positive impact on total net greenhouse gas emissions. Unlike many other agricultural greenhouse gas calculators, the CFT includes calculations of soil carbon sequestration, which is a key feature of agriculture that has both mitigation and adaptation benefits.

The CFT was vetted, improved and adapted over two years (2010-12) through the global farming assessment Cool Farming Options, led by the Sustainable Food Lab in conjunction with University of Aberdeen and Unilever. Cool Farming Options was supported by 17 sponsoring partners and involved CFT pilots in 16 crops, in 15 countries. The project had an additional eight non-sponsoring partners with pilots in seven other countries and six other crops.