Author Archives: Gordon Rogers

Vegetable carbon calculator

The Vegetable Carbon Calculator is a free tool that allows you to develop a carbon footprint of a vegetable farming operation. The tool was developed as part of a HAL project (VG09187), funded by Australian Vegetable Growers through HAL with support from Houston’s Farms (Tasmania) and Woolworths.

The tool provides a framework and baseline data that growers can use to develop a carbon footprint for their own farming operation.

The Vegetable Carbon Calculator website also provides training materials on how to use the tool and some background information on concepts surrounding carbon and carbon footprinting.

How the tool works

The tool allows growers to develop their own carbon footprint and requires that data be entered under the following categories:

  1. Energy
  2. Waste
  3. Fertiliser
  4. Refrigerants used
  5. Land use

Once this data is entered into the tool, it calculates a carbon footprint, which can then be exported from the calculator.

Assumptions, methodology and estimation of direct on-farm emissions

The methodology employed by the tool and assumptions and emissions factors are given in a protocol document, which is available for downloading on the Vegetable Carbon Calculator.

There is very little data available on direct greenhouse gas emissions for vegetable crops in Australia. The research has not yet been completed to determine the actual emissions of nitrous oxide and carbon dioxide from Australian soils under local conditions and for various crop management practices. The carbon vegetable tool developers have therefore used best-available estimates of these emissions from overseas research and data from other crops.

The Vegetable Carbon Calculator website has two components:

  1. The vegetable carbon calculator.
  2. Vegetable industry carbon education materials.

The education materials were funded by Woolworths and HAL. The calculator was based on the Houston’s Farms Footprinting Tool, which was made available to the project development team.

How to use the tool

In order to estimate your on-farm carbon footprint, you will need to have the following information available for the year for which you want to calculate the carbon footprint of your farm:

  • Electricity bills/meter records for the reporting year.
  • Fuel bills/receipts for the reporting year (i.e. natural gas, petrol, diesel, LPG, wood).
  • Records of waste processed on-farm for the reporting year.
  • Records of fertiliser usage for the reporting year.
  • Service documents for on-site cold rooms or industrial freezers for the reporting year.

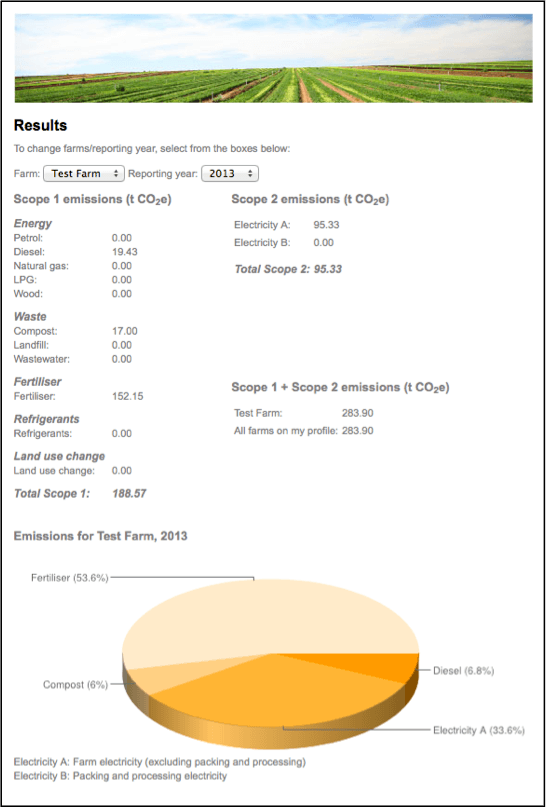
Output from the tool

The tool can provide four specific outputs:

  • Farm footprint for your farm for the years for which data was entered
  • Compare various crops by years
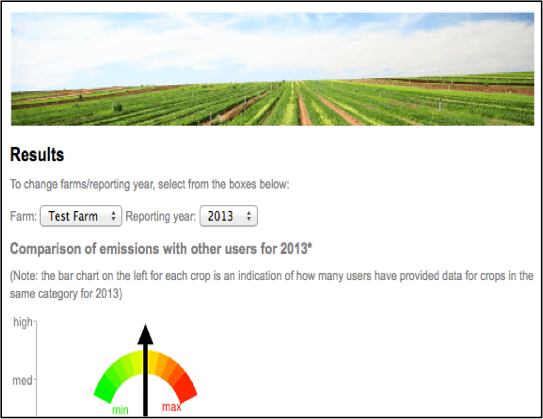
  • Calculate emissions by the different crops grown
  • Compare the emissions per crop with other users of the tool for the year in question.

veg carbon footprint output veg carbon footprint output2


Climate dogs

The Victorian DPI, NSW DPI and the Bureau of Meteorology have developed a series of videos that explain how global climate processes vary their behaviour, potentially resulting in wetter or dryer seasons.

Climate dogs video series show, in an entertaining way, how climate drivers work by herding rain towards or away from NSW and Victoria. The five ‘climate dogs’, representing the climate processes, are Enso, Indy, Ridgy, Sam and Eastie.

These five sheepdogs love rounding up our rainfall. From a farmer’s perspective, when they are well behaved they bring moisture from the oceans and allow it to fall over Victoria and NSW as rain, hopefully delivering the right amount at the right time. But they don’t always work the way we’d like them to and can sometimes scatter the mob, effectively chasing rainfall away. Over recent decades some of these dogs have changed their behaviour, contributing to our extended dry spell and the changing weather patterns that many farmers have noticed.

dog Enso


ENSO
El Niño–Southern Oscillation or El Niño/La Niña–Southern Oscillation. Changes in Enso’s behaviour have a significant influence on rainfall probabilities in inland NSW during the winter and spring period.

dog Indy


INDY
Indian Ocean Dipole (IOD). Like Enso, changes in Indy’s behaviour also have a significant influence on rainfall probabilities in inland NSW during winter and spring.


dog RidgyRIDGY
Sub-tropical Ridge (STR). Ridgy’s position and intensity have a significant influence on weather in NSW. Recent changes in Ridgy’s behaviour appear to be driving some significant changes to southern NSW rainfall patterns.


SAMdog Sam

Southern Annular Mode. Recent changes in Sam’s behaviour increase probabilities of rainfall in spring and summer in some parts of NSW.


EASTIEdog eastie
East Coast Low. Eastie, better known as the East Coast Low, represents the deep low-pressure systems that are an important climate feature along the southeast coast of Australia.


SILO

SILO is a database of about 120 years of continuous daily weather records for Australia, which includes:

  • Rainfall
  • Temperatures (minimum and maximum)
  • Radiation
  • Evaporation
  • Vapour pressure

The records are based mainly on observed data, with interpolation where there are data gaps. SILO data is up-to-date (near real time), in formats useful for farmers, researchers and policy-makers and is a data source for seasonal climate models and environmental forecasting models.

SILO includes climate data from around 3,800 Bureau of Meteorology stations across Australia. This data is then combined to produce a 5km grid with a total of 350,000 grid squares.

The user can enter a location (by nearest weather station) and a date range. The data can be delivered in a range of formats, suitable for input into programs such as Rainman. It should be noted that there are no projections or predictions, it is simply a data set of previous records.

SILO data is available by subscription through the Bureau of Meteorology website.