Author Archives: Gordon Rogers

Australian CliMate

photo Tim Hughes

CliMate is a suite of climate analysis tools delivered on the Web, iPhone, iPad and iPod touch devices. The app can be downloaded from the Apple App store or click HERE to visit the website.

CliMate allows you to interrogate climate records to ask a number of questions relating to rainfall, temperature, radiation, as well as derived variables such as heat sums, soil water and soil nitrate. CliMate also provides information based on El Nino Southern Oscillation patterns. It is designed for decision makers who use past weather statistics, forecasts and knowledge of system status (e.g. soil water, heat sum) to better manage their business.

CliMate has a number of analyses structured around the following questions:

  • How often? What is the chance of a sowing event based on amount of rainfall over 5 days? How often is a heat sum achieved in a set period of time? What is the probability of temperature being below a critical level for germination or flowering?
  • How hot-cold? When determining an ideal sowing date, when are heat and cold stresses lowest for the optimum flowing time?
  • Season’s progress? When adjusting inputs during a crop or pasture season, how does the current season compare with previous conditions in terms of rainfall, temperature, heat sum or radiation?
  • How wet? N? How much water and nitrate have I stored over the fallow? This may help me adjust inputs to better match yield expectations.
  • How likely? Based on current ENSO conditions, what is the probability that rainfall or temperature is greater than or less than key thresholds (e.g. terciles, median) and how reliable have these forecasts been in the past?
  • How’s El Nino? What is the current ENSO status based on key atmospheric and oceanic indicators? What is the Australian Bureau of Meteorology’s interpretation of this?
  • How dry? Coming Soon! Based on recent rainfall records, are we likely to be facing a drought in the near future or are we in a drought now? And how do current dry conditions compare with previous droughts?
  • How’s the Past? Presents views of monthly and annual rainfall and temperature summaries to allow you to explore relationships and patterns.

Energy audits

Energy audits are an excellent way of measuring farm energy use and potentially saving money on electricity bills. Audits are expensive, in the order of $10,000 for a detailed level 2 audit of a large-scale vegetable farm, but savings can be considerable, and the pay-back period is commonly about 1-2 years. In addition, there is funding assistance available. Applicable programs include:

  • Low Carbon Australia with loans or other financial assistance to upgrade key equipment, such as cool rooms and electric pumps, to increase energy efficiency (section 5.5.3).
  • State-based programs – most States have grants available for making improvements in energy efficiency. Refer to section 5.6 for details.

A recent project that audited nine irrigation farms in Tasmania made the following conclusions:

  • Total energy bills (electricity + fuel) varied from $35,000 to $156,000 per year, with the average being just over $80,000 per year. Electricity bills accounted for an average 64% of the total energy bill or nearly $52,000 per year.
  • Irrigation accounted for 70‐80% of farm energy costs.
  • The average energy index for irrigated areas was 1,268 kWh/ha ($216/ha).
  • For those irrigation systems with flow meters installed, energy indices were calculated at between 200 kWh/ML and 500 kWh/ML, or about $35/ML to $85/ML. Variations depended on pump/irrigation sets efficiencies and the Total Dynamic Heads for those pumps.

Improving energy efficiency may be one of the fastest, cheapest and easiest ways to reduce farm energy expenditure and greenhouse gas emissions.

Types of energy audits

There are three main types of energy audits used for assessing farm energy use:

Energy Audit Method Level 1: Preliminary Audit
(Overview of the Total Energy Consumption On-site, Whole Farm Approach)

This is the simplest and cheapest form of energy audit. A whole-of-farm approach is usually adopted. This involves collating all the energy use data from the farm, including the total fuel (diesel, petrol and other fuels) and the total electricity energy consumed. It is generally expected that these figures will be available from the farm receipts. The total energy uses are then divided by the total farm production to derive the energy insensitivities of the site. Usually no additional tools are required for this level of audit.

Energy Audit Method Level 2: Standard/General Audit
(Itemised Farm Approach)

Level two energy audits generally involve breaking down the total energy usage on the farm into energy used in each farming operation. A level 2 will usually consist of a bowser and electricity meter-box type measurement for all processes, and with specific “spot” measurements for the key processes. It may also involve in-depth farmer interviews to identify the major energy usages.

Energy Audit Method Level 3: Detailed Audit
(Specific Operation Investigation)

The aim of level three energy audits is to investigate ways to improve the efficiency of a specific operation. Typically, level 3 audits would focus where the greatest energy consumption has been identified from level 2. This will usually involve a range of different sensors to measure the performance of different machines. Examples of sensors used may include (irrigation head) pressure, flow rate, engine RPM, tractor travel speed, torque, load and temperature etc. A data logger may be required to record the data over a considerable period of time. A level 3 energy audit may be necessary to certify a product/farming operation and to establish the energy-star rating and labelling scheme.

Tools available to assist with energy audits

EnergyCalc

EnergyCalc was developed for cotton/grain production by the National Centre for Engineering in Agriculture, University of Southern Queensland. It is a software tool originally developed by NCEA to quantify operational/direct energy inputs on farm and to determine greenhouse gas emissions due to energy uses. EnergyCalc assesses direct on-farm energy use, costs and the greenhouse gas emissions (GHGs) associated with diesel, petrol, LPG and electricity consumption. Energy use is examined across key processes within a production system and can be used to evaluate farming practices such as tillage, spraying, irrigation and post harvest. It is most useful in a level 2 energy audit.

Nursery industry energy calculator

The Australian nursery industry in collaboration with the University of Southern Qld has developed a Renewable Energy Calculator based on the EnergyCalc tool. The calculator is available online via the NGIA website. Although designed for use by the nursery industry, it could also be useful for vegetable growers. The tool will help calculate the current energy load within a business and calculate the renewable energy required to offset the energy cost.

Energy Self Audit Tool

Hydro consulting Tasmania has produced a booklet which aims to help Tasmanian farmers conduct a self audit of energy use on their farm. It also allows them to establish their historical energy use, develop energy use benchmarks, set energy-saving targets, and identify and implement energy-saving measures to meet those targets.


Generating electricity on-farm

There are a number of electrical power generation technologies which are suitable for use on farm.  These options can be compared using the ‘levelled cost of energy’ (LCOE). This is the average price of electricity generated over the plant life taking into account all costs and maintenance required. As it takes into account all costs involved in operating a plant, the LCOE can be compared to prices paid at the farm gate.

Options include:

  • Natural gas fuelled electrical generator. Such technologies are already widespread at capacities of 10kW – 1MW.
  • LPG fuelled electrical generator. LPG delivered to the farm gate is signfiicantly more expensive than LPG prices in cities. LPG costs at least 75c/L, which is 10-20c/L higher than central Melbourne and Sydney. Some suppliers appear to charge almost twice this for delivery.
  • Natural gas fuel cell. Rather than powering an electrical generator, natural gas powers a ‘solid oxide fuel cell’ (SOFC). Although SOFCs are more efficient than combustion engines, they are also more costly.
  • Biomass generation. This involves burning plant materials in a steam turbine plant boiler. Several of these plants already operate nationally. Where this can be powered using waste products from the farm, fuel price is virtually zero.
  • Wind turbines. These come in a large range of sizes, generating 10kW to 2MW. Turbines 100kW to 2MW are expected to be the main growth market in the future. Capacity factors vary greatly; Up to 40% may be realised at a windy site, but only 10% at a poorer location.
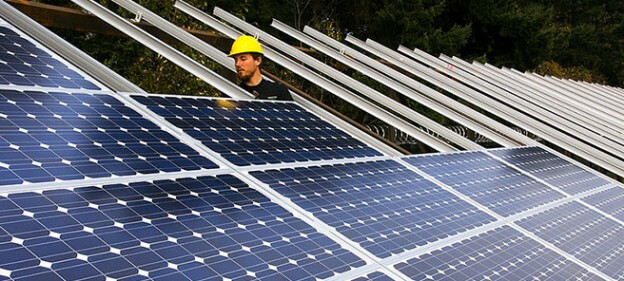
  • Solar photovoltaics (PV). Larger PV installations ranging from 100kW to 2MW appear to be plausible for on-fram use.
  • Biogas. Biogas production involves anaerobic digestion of waste materials including finely chopped plant materials, manures and even sewage. This produces a mixture of methane and CO2 which can be used to power a generator. The process also produces solid and liquid ‘digestate’ which may be a useful fertiliser for the property. Where waste materials from the farm are used fuel costs are minimal.

Biogas productionbiogas prod diagram

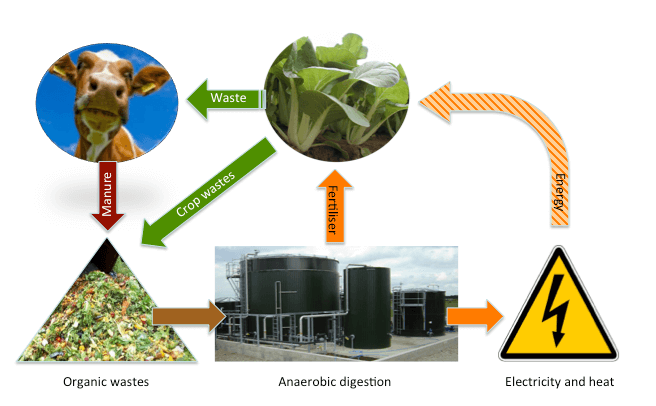
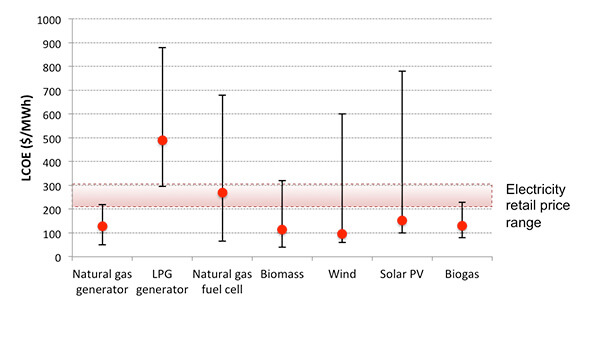
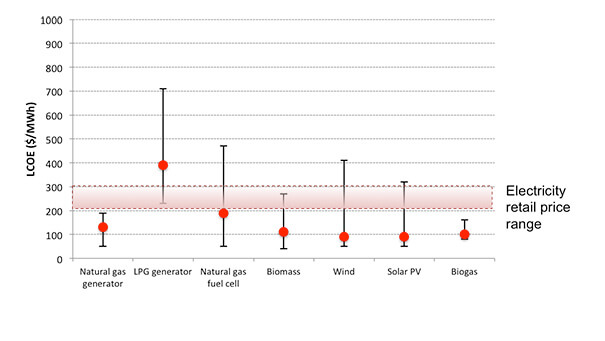
The graph below indicates the estimated current average LCOE for these options. The top of the bar indicates pessimistic pricing while the bottom of each bar shows an optimistic pricing. So for example, the lower value for biomass is based on using waste materials available on farm, while the upper limit shows the potential cost if suitable materials need to be purchased and brought in. Similarly, for wind power the upper limit is based on the turbine operating at 40% of capacity, the lower at it operating at only 10% of capacity.

The analysis of the current financial situation shows that both biogas from waste materials and a natural gas fuelled generator would be consistently financially viable at current prices.

The current carbon price, which has been ignored in this report due to uncertainty in its future, only adds roughly $10-15 /MWhr to the cost of electricity generated from natural gas. However, this option relies on a grid connection to natural gas, making it is feasible only for farms close to urban centres, such as some protected-cropping operations.

Most growers do not have access to the gas network on-site, forcing them to use LPG or diesel for their on-site, engine-based power generation. As shown below for LPG, these fuels are significantly more expensive, and so only appropriate for backup power.

Estimated current LCOEs for on-site power generation

LCOE 2013


Note that electricity fed back into the grid sells for only $50-$79/MWh
(unless a subsidy is in place, as can be the case for solar and wind power).  This means that MOST power generation options are only worthwhile if the energy is used on-farm.

When the same scenario is modelled for 2030, the results are markedly different – even without any increase in electricity prices (which seems improbable!). The modelled improvements in plant performance and plant cost now result in several technologies – natural gas, biomass, solar PV and biogas – becoming consistently financially viable even if average retail electricity prices remain in the range $200-300/MWhr. Wind may also be viable, depending mainly on the quality of the local wind resource and hence its capacity factor. Again, a price on carbon has been ignored. This only affects the natural gas engine plant, the sole viable non-renewable plant. With the Federal Government’s currently modelled ‘core’ 2030 carbon price of roughly $50/tCO2 adds approximately $30/MWhr to the LCOE of this plant.)

Importantly, this analysis finds that several of these on-site power generation technologies may become viable without any form of incentive in the coming years. Such incentives currently include a price on carbon, renewable energy certificates (RECs) and feed-in-tariffs, all of which face an uncertain future as discussed above. Increases in retail electricity prices will further encourage uptake of alternative power generation options. Overall, this analysis therefore presents a positive view of future, on-farm power generation options in Australia.

Estimated projected LCOEs for on-site power generation in 2030

LCOE 2030

 Assumptions made in this analysis;

  • Total Plant Cost TPC ($/kW): This is the cost of building and commissioning the plant. It is accounted for as an initial lump sum in year 0. The TPC of all thermal plant is modelled to improve at 1% p.a. from 2013 to 2030, whilst TCPs of the fuel cell, wind and solar PV are modelled as improving at 2%, 2% and 5% p.a. respectively. These assumed learning rates result in 2030 LCOEs that are comparable to publically available studies, when the same inputs are used.
  • Efficiency: This is the electrical energy output per unit fuel energy. The efficiency of all thermal plant and the fuel cell is modelled to improve at 1% p.a. from 2013 to 2030.
  • Operating and maintenance costs ($/MW): These include labour and equipment.
  • Fuel costs ($/GJ): These span typical current ranges.
  • Depreciation: We assume linear depreciation over the book life. The book life is also assumed to be equal to the debt life and plant life.
  • The (real) discount rate (%): The discount rate is the product of the debt rate times the percentage of debt financing plus the equity return rate times the percentage of equity financing. This modelling assumes equal debt-to-equity financing, with the real equity and debt rates 2% higher and 2% lower respectively than the stated real discount rates.
  • Capacity factor: The capacity factor is the average power generated by a plant in a given year relative to its rated capacity.
  • Inflation: This was set at zero in this analysis to avoid distortion of many years of inflation.
  • Income taxes: This was set at zero in this analysis since growers are unlikely in most cases to earn significant income from electrical power generation in the first instance, but rather offset their on-site electricity consumption.
  • Incentive programmes: This analysis does not assume a carbon price, renewable energy certificates (RECs), feed-in-tariffs or any other incentive because of the significant uncertainty in their future. The current Opposition has pledged to end the carbon price should it be elected later this year. The issuing of RECs is currently scheduled to end in 2020. Feed-in-tariffs, particularly for solar PV, have been reduced significantly in all States in recent years.