There are a number of electrical power generation technologies which are suitable for use on farm. These options can be compared using the ‘levelled cost of energy’ (LCOE). This is the average price of electricity generated over the plant life taking into account all costs and maintenance required. As it takes into account all costs involved in operating a plant, the LCOE can be compared to prices paid at the farm gate.
Options include:
- Natural gas fuelled electrical generator. Such technologies are already widespread at capacities of 10kW – 1MW.
- LPG fuelled electrical generator. LPG delivered to the farm gate is signfiicantly more expensive than LPG prices in cities. LPG costs at least 75c/L, which is 10-20c/L higher than central Melbourne and Sydney. Some suppliers appear to charge almost twice this for delivery.
- Natural gas fuel cell. Rather than powering an electrical generator, natural gas powers a ‘solid oxide fuel cell’ (SOFC). Although SOFCs are more efficient than combustion engines, they are also more costly.
- Biomass generation. This involves burning plant materials in a steam turbine plant boiler. Several of these plants already operate nationally. Where this can be powered using waste products from the farm, fuel price is virtually zero.
- Wind turbines. These come in a large range of sizes, generating 10kW to 2MW. Turbines 100kW to 2MW are expected to be the main growth market in the future. Capacity factors vary greatly; Up to 40% may be realised at a windy site, but only 10% at a poorer location.
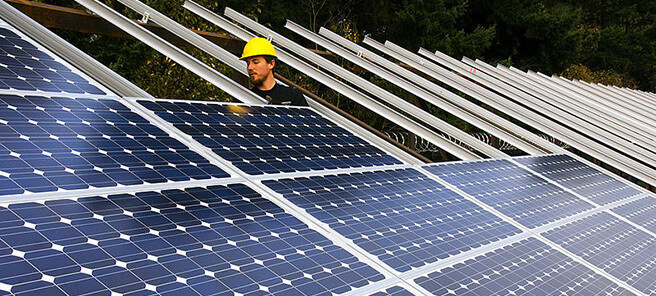
- Solar photovoltaics (PV). Larger PV installations ranging from 100kW to 2MW appear to be plausible for on-fram use.
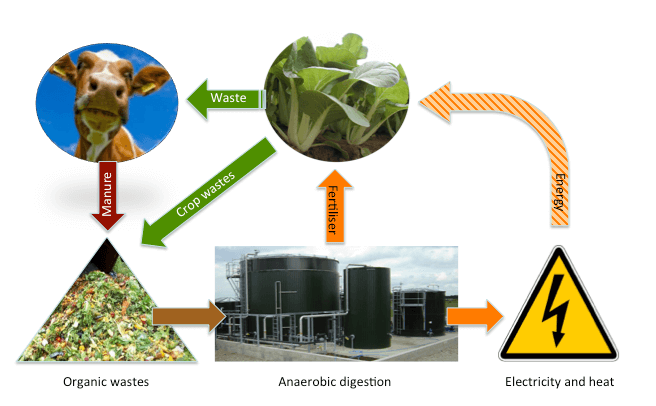
- Biogas. Biogas production involves anaerobic digestion of waste materials including finely chopped plant materials, manures and even sewage. This produces a mixture of methane and CO2 which can be used to power a generator. The process also produces solid and liquid ‘digestate’ which may be a useful fertiliser for the property. Where waste materials from the farm are used fuel costs are minimal.
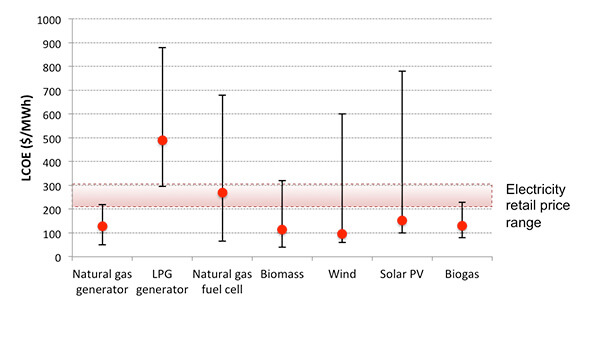
The graph below indicates the estimated current average LCOE for these options. The top of the bar indicates pessimistic pricing while the bottom of each bar shows an optimistic pricing. So for example, the lower value for biomass is based on using waste materials available on farm, while the upper limit shows the potential cost if suitable materials need to be purchased and brought in. Similarly, for wind power the upper limit is based on the turbine operating at 40% of capacity, the lower at it operating at only 10% of capacity.
The analysis of the current financial situation shows that both biogas from waste materials and a natural gas fuelled generator would be consistently financially viable at current prices.
The current carbon price, which has been ignored in this report due to uncertainty in its future, only adds roughly $10-15 /MWhr to the cost of electricity generated from natural gas. However, this option relies on a grid connection to natural gas, making it is feasible only for farms close to urban centres, such as some protected-cropping operations.
Most growers do not have access to the gas network on-site, forcing them to use LPG or diesel for their on-site, engine-based power generation. As shown below for LPG, these fuels are significantly more expensive, and so only appropriate for backup power.
Estimated current LCOEs for on-site power generation
Note that electricity fed back into the grid sells for only $50-$79/MWh
(unless a subsidy is in place, as can be the case for solar and wind power). This means that MOST power generation options are only worthwhile if the energy is used on-farm.
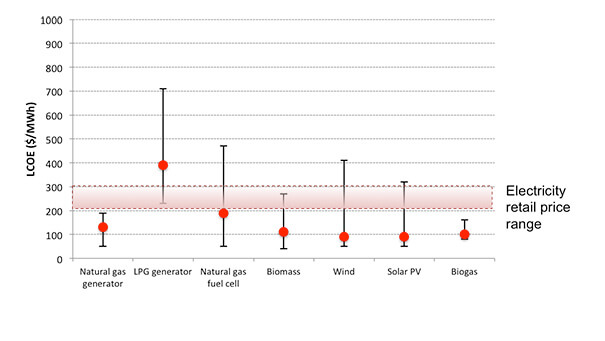
When the same scenario is modelled for 2030, the results are markedly different – even without any increase in electricity prices (which seems improbable!). The modelled improvements in plant performance and plant cost now result in several technologies – natural gas, biomass, solar PV and biogas – becoming consistently financially viable even if average retail electricity prices remain in the range $200-300/MWhr. Wind may also be viable, depending mainly on the quality of the local wind resource and hence its capacity factor. Again, a price on carbon has been ignored. This only affects the natural gas engine plant, the sole viable non-renewable plant. With the Federal Government’s currently modelled ‘core’ 2030 carbon price of roughly $50/tCO2 adds approximately $30/MWhr to the LCOE of this plant.)
Importantly, this analysis finds that several of these on-site power generation technologies may become viable without any form of incentive in the coming years. Such incentives currently include a price on carbon, renewable energy certificates (RECs) and feed-in-tariffs, all of which face an uncertain future as discussed above. Increases in retail electricity prices will further encourage uptake of alternative power generation options. Overall, this analysis therefore presents a positive view of future, on-farm power generation options in Australia.
Assumptions made in this analysis;
- Total Plant Cost TPC ($/kW): This is the cost of building and commissioning the plant. It is accounted for as an initial lump sum in year 0. The TPC of all thermal plant is modelled to improve at 1% p.a. from 2013 to 2030, whilst TCPs of the fuel cell, wind and solar PV are modelled as improving at 2%, 2% and 5% p.a. respectively. These assumed learning rates result in 2030 LCOEs that are comparable to publically available studies, when the same inputs are used.
- Efficiency: This is the electrical energy output per unit fuel energy. The efficiency of all thermal plant and the fuel cell is modelled to improve at 1% p.a. from 2013 to 2030.
- Operating and maintenance costs ($/MW): These include labour and equipment.
- Fuel costs ($/GJ): These span typical current ranges.
- Depreciation: We assume linear depreciation over the book life. The book life is also assumed to be equal to the debt life and plant life.
- The (real) discount rate (%): The discount rate is the product of the debt rate times the percentage of debt financing plus the equity return rate times the percentage of equity financing. This modelling assumes equal debt-to-equity financing, with the real equity and debt rates 2% higher and 2% lower respectively than the stated real discount rates.
- Capacity factor: The capacity factor is the average power generated by a plant in a given year relative to its rated capacity.
- Inflation: This was set at zero in this analysis to avoid distortion of many years of inflation.
- Income taxes: This was set at zero in this analysis since growers are unlikely in most cases to earn significant income from electrical power generation in the first instance, but rather offset their on-site electricity consumption.
- Incentive programmes: This analysis does not assume a carbon price, renewable energy certificates (RECs), feed-in-tariffs or any other incentive because of the significant uncertainty in their future. The current Opposition has pledged to end the carbon price should it be elected later this year. The issuing of RECs is currently scheduled to end in 2020. Feed-in-tariffs, particularly for solar PV, have been reduced significantly in all States in recent years.


