Author Archives: Gordon Rogers

Irrigation system design and maintenance

Good irrigation system design and maintenance has the potential to both lift productivity and reduce energy costs.

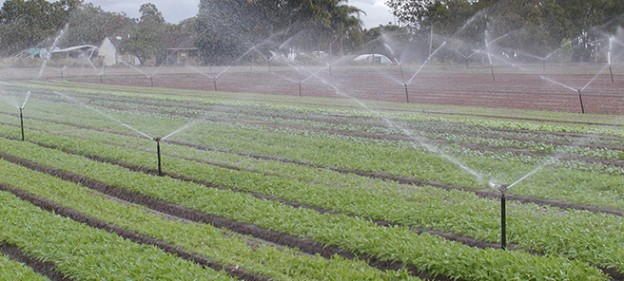
Distribution uniformity (DU) is a measure of how evenly an irrigation system applies water. Low DU means that some parts of the crop are too wet while others are under-watered. Many growers compensate by irrigating to satisfy the driest area of the crop. This extends irrigation run times, increasing power consumption.

In WA the additional power used to overcome poor DU was estimated to increase power consumption by 700 KWh/ha per year across 16 vegetable growers, with the worst irrigation system adding 2,000 KWh/ha annually to the power bill of one grower.

Energy costs can also be reduced by making sure the irrigation system is running at the designed pressure and flow rate, or changing the system to reduce the required pressure.

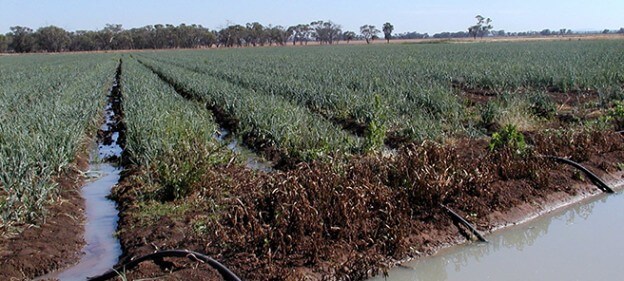
Of the 16 vegetable properties in WA, 9 had acceptable irrigation systems. the other 7 had problems due to incorrect pipe sizes or lack of adjustment for slope. These problems were compensated for by increasing the pumping pressure and, therefore, the energy required to apply the same amount of water.

Improving DU ensures the entire crop receives the right amount of water, lifting total productivity as well as reducing power consumption.  Solid set and traveller irrigation systems for cauliflower, lettuce and sweet corn have all been found to have distribution uniformity of only around 70%. Increasing DU to 90% or more can increase yield by 7 – 13%.

Energy use varies greatly between systems. For example, while furrow irrigation may require only 45 KWh / ML, a high pressure traveller may require 543 KWh / ML. In the Tasmanian example shown below, energy savings of 66% and a total cost saving of $47.12 / ML can be obtained by changing from a high pressure travelling gun to a low pressure centre pivot.

Travelling gun Centre pivot
Hydraulics (m)
End pressure 52 14
Friction loss in irrigator or hose 28 0.7
Hose  –  mainline 4.1 2.8
          –  sundry 7 7
Static head 7 7
Total head 106.1 39.5
Pump
Pump duty 17.1 l/s @ 106.1m 18.5 l/s @ 39.5m
Pump efficiency 66% 81%
Motor efficiency 92% 92%
Costs
Cost per hour  –  off peak $3.22 $1.06
                      –  peak $7.33 $2.41
Run time (hours per day) 15 15
Total KWh / day 443 146
Cost per day $64.77 $21.27
Cost per ML $70.16 $23.04

However, the biggest advantage in changing irrigation systems may be improved crop management with resulting increases in yield and quality. For example, replacement of a travelling gun with a centre pivot in a NSW farm provided an energy saving of around $50/ha. But the bigger benefit was a 20% increase in yield and improved product quality. Combined, these resulted in a net benefit of $565/ha.


Scott Barber & Steven R. Raine 2002. Using commercial distribution uniformity and yield data to improve irrigation management. International Water & Irrigation, 22,17-22.


Improving irrigation efficiency

Moving and pressurising water requires a lot of energy. As a result irrigation is the major energy user in growing vegetables.

For most growers, improving productivity, i.e. increasing the revenue for the amount of energy used, is more important to the bottom-line than simply improving the energy efficiency and reducing energy costs.

Managing irrigation well delivers improvements in water productivity ($/ML) through increases in yield and/or quality and hence revenue per ML of water applied.  In a similar way improving energy productivity ($/KWh) will be more about increases in yield and/or quality and hence revenue per KWh of energy used. This productivity approach will be a stronger motivator than simply reducing the cost, whether it is for water or energy.

There are three areas where irrigation improvements could increase energy productivity or reduce energy usage, these being:

  • Crop management.
  • Irrigation system design and maintenance.
  • Pump efficiency.

Similar reductions in on-farm energy use can be made by improving either pump efficiency or irrigation system design and maintenance. For example, in a survey of 16 vegetable growers in the Peel-Harvey valley, half the potential saving came from fixing up the irrigation system and the other half from optimising pump and motor performance.  A wide range of irrigation tools have been developed to assist growers, consultants and designers to improve irrigation management. Many of these will also improve energy productivity and/or reduce costs.

Water use efficiency varies hugely between growers. For example, a study of citrus growers found a 10x difference in water productivity, ranging from 0.8t/ML to 8.0t/ML. Converting this to energy productivity produces a range of 0.4 to 3.5 tonnes produced per 100 KWh of electricity used for irrigation.

In general, the higher the head pressure, the more energy is required.

Irrigation system Total operating head
(m)
Electricity required
(KWh/ML)
Furrow  –  river  10 45
            –  bore  45 204
 Pivot or linear move, low pressure  40 181
 Drip or micro irrigation system 50  226
 Spray  –  river 55  258
           –  bore  65 294
 Traveller  –  river, medium pressure  85 385
                –  bore, medium pressure 90 407
                –  high pressure 120  543

Irrigation scheduling is an important aspect of improving crop productivity. There are many guides to irrigation scheduling including;

Managing water for yield and profit   and

Understanding Irrigation Decisions 

Shopping around for cheaper energy

In addition to potential savings through improving energy efficiency, there are changes occurring in the energy marketplace that can also reduce costs. The electricity market is currently undergoing reform to introduce greater flexibility and transparency under the National Energy Customer Framework. The aim of this national reform is to ensure customers have consistent information on energy pricing and terms and conditions, which promotes competition in the market place.

Currently South Australia, Tasmania and ACT are part of the National Energy Customer Framework, allowing customers to compare the offerings of a range of retailers, based on their usage patterns. In Tasmania the increased flexibility has resulted in more competition and improved prices for many growers. New South Wales is expected to join the scheme in July 2013, with Queensland and Victoria joining in 2014.

For larger electricity users care should be taken to examine both the fixed costs, i.e. the network tariff, and the variable costs, i.e. the per KWh cost. Because of the highly variable electricity usage patterns associated with irrigation, due to seasonal, rainfall and cropping cycles, the way in which the network tariff is applied can have a major impact on the overall cost of electricity.